Linear Regression Simple yet Elegant
Two major types of problems that machine learning algorithms try to solve are:
- Regression — Predict continuous value of a given data point
- Classification — Predict the class of the given data point
Linear Regression, intuitively is a regression algorithm with a Linear approach. We try to predict a continuous value of a given data point by generalizing on the data that we have in hand. The linear part indicates that we are using a linear approach in generalizing over the data.
An example
Examples makes it easy to understand, so suppose you want to predict the price of a house by knowing its size. You have the data which has some house prices and corresponding sizes. Charting the data and fitting a line among them will look something like this:
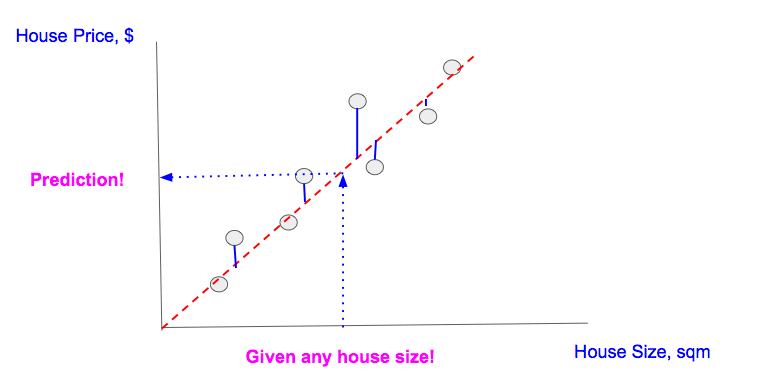
To generalize, you draw a straight line such that it crosses through the maximum points. Once you get that line, for house of any size you just project that data point over the line which gives you the house price.
That is it. You are done. But wait!
The Real Problem
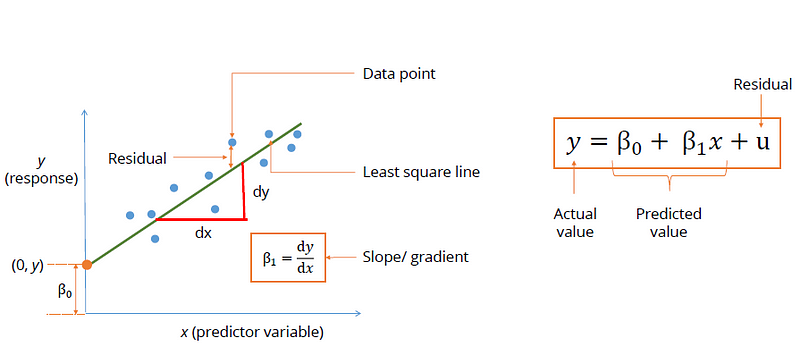
The problem was never finding the house price. The problem was to find the best fit line which generalizes over the data well.
The same old line equation is used: y = mx +c with a little statistical look and some below terminologies are added specific to Linear Regression modeling.
We will go over the elements of the equation one by one:
- y — The value that you want to predict
- β₀ — The y-intercept of the line means where the line intersects the Y-axis
- β₁ — The slope or gradient of the line means how steep is the line
- x — The value of the data point
- u — The residual or noise that are caused by unexplained factors
Seems like we can easily come to best parameter values by hit and trial method and thus finding the best fit line. But things are not that easy when the problem you are solving has more dimensions which is also known as the The Curse of Dimensionality.
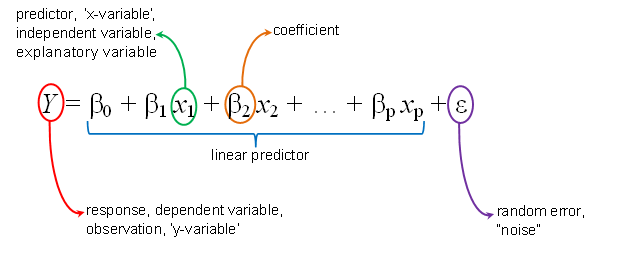
The Multiple Linear Regression will have n number of features and we have to find a line which fits all the data points for all the dimensions. You have started to realize that it is no longer a hit-and-trial solution.
Mathematics to the rescue
We can draw infinite number of lines but never be sure that the line is the best fit or not, so here enters our savior: The Cost Function
“Mathematics is the queen of Science”
I have been running from mathematics my whole life, but you see, you just cannot escape from it. It’s really intuitive and gives you the ability to see what’s going on under the hood.
The Cost Function is a mathematical construct which is calculated by adding up the squared error terms
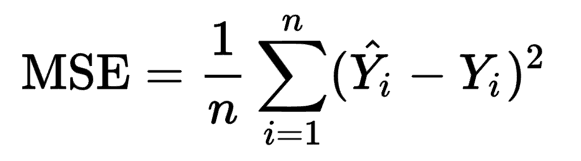
By tweaking the above equation a little we get the below equation:
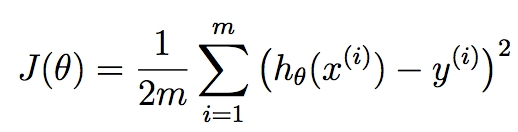
where J is cost notation and θ is the parameter
Our goal is to reduce the Cost function, which in turns improves the accuracy. We can take the parameter values by hit and trial method and calculate MSE for each combination of parameters, but that is not an efficient technique. Seems like there is a calculus solution to this problem.
Gradient Descent
Gradient Descent is a simple optimization technique for finding minimum of any function, in this case we want to find the minima of our MSE function.
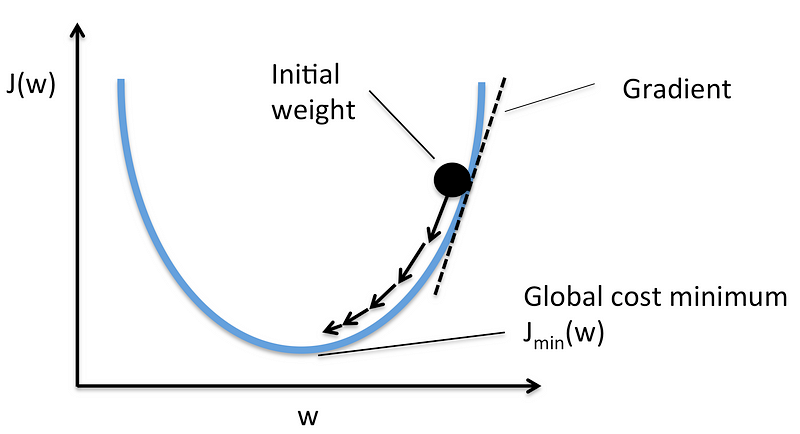
You can visualize the function as a valley, and you are standing on some random point. Your aim is to reach the bottom most point of the valley and Gradient Descent help you in reaching to the bottom most point of the valley.
Here is how you will do it:
You will see and make out where the slope of the valley is going down, then you start taking steps towards the down going slope. Once you see that every contour around you is higher than where you are standing you claim that you have reached the bottom most point.
Here is how Gradient Descent will do it:
It has to know where the slope of the valley is going (and it doesn’t have eyes as you do) so it takes the help of mathematics here.
To know the slope of a function at any point you differentiate that point with respect to its parameters, thus Gradient Descent differentiates the above Cost function and comes to know the slope of that point.
To go to the bottom most point it has to go in the opposite direction of the slope, i.e. where the slope is decreasing.
It has to take small steps to move towards the bottom point and thus learning rate decides the length of step that gradient descent will take.
After every move it validates that the current position is global minima or not. This is validated by the slope of that point, if the slope is zero then the algorithm has reached the bottom most point.
After every step, it updates the parameter (or weights) and by doing the above step repeatedly it reaches to the bottom most point.
Victory
Once you have reached the bottom most point of the valley that means you have got the parameters corresponding to the least MSE or Cost function, and these values of parameters will fetch you the highest accuracy.
You can now use your Linear Regression model to predict the dependent variable of any unforeseen data point with very high accuracy.
If you are still here me with then you have got the concepts of Linear Regression and you are ready to apply it to solve real world problems which matter.
Applications of Linear Regression
- Sales Driver Analysis — Linear Regression can be used to predict the sale of products in the future based on past buying behavior
- Predict Economic Growth — Economists use Linear Regression to predict the economic growth of a country or state
- Score Prediction — Sports analyst use linear regression to predict the number of runs or goals a player would score in the coming matches based on previous performances
- Salary Estimation — An organisation can use linear regression to figure out how much they would pay to a new joinee based on the years of experience
- House Price Prediction — Linear regression analysis can help a builder to predict how much houses it would sell in the coming months and at what price
- Oil Price Prediction — Petroleum prices can be predicted using Linear Regression


